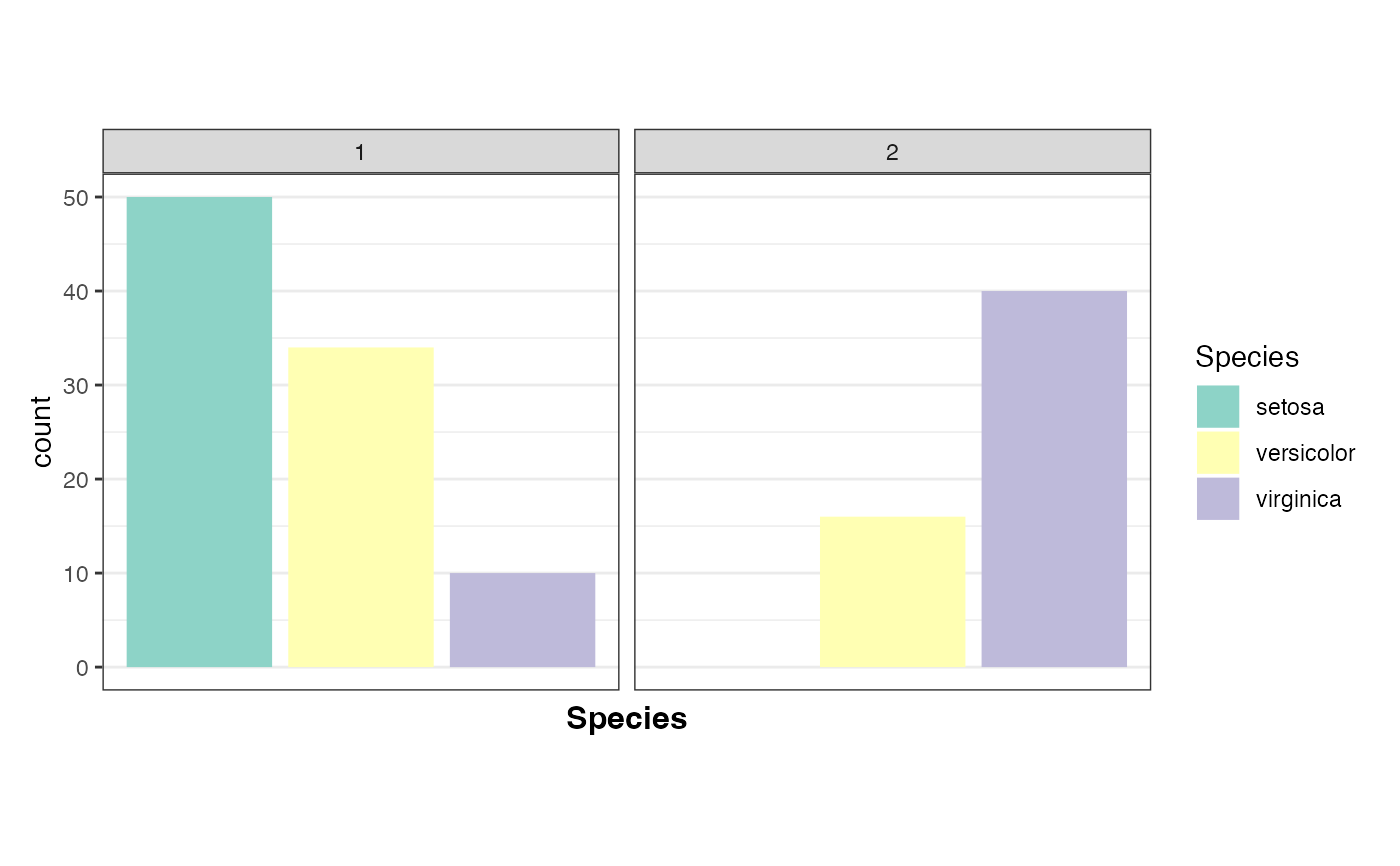
Plot distribution of annotation data across clusters
plot_annotation_dist(annotations_df, cluster_labels, selected_clusters = NULL)Arguments
- annotations_df
data frame with variables not used in clustering
- cluster_labels
output from
cut_clusters()- selected_clusters
optional vector of cluster labels to include in plots
Value
a patchwork object
Examples
dmat <- compute_dmat(iris, "euclidean", TRUE, c("Petal.Length", "Sepal.Length"))
clusters <- compute_clusters(dmat, "complete")
cluster_labels <- cut_clusters(clusters, 2)
plot_annotation_dist(iris["Species"], cluster_labels)