Faceted boxplots with points or violin plots
facet_boxplot(
  df,
  x,
  y,
  facet_var = NULL,
  boxplot_colors = NULL,
  shape = c("boxplot", "violin"),
  plot_points = TRUE
)
Arguments
- df
a data frame containing all the variables matching the remaining arguments
- x
categorical variable
- y
continuous variable
- facet_var
optional variable to facet data
- boxplot_colors
list of colors to use as fill for boxplots
- shape
either "boxplot" or "violin"
- plot_points
boolean variable to overlay jittered points or not. Default is
TRUE
Value
a ggplot2::ggplot object
Examples
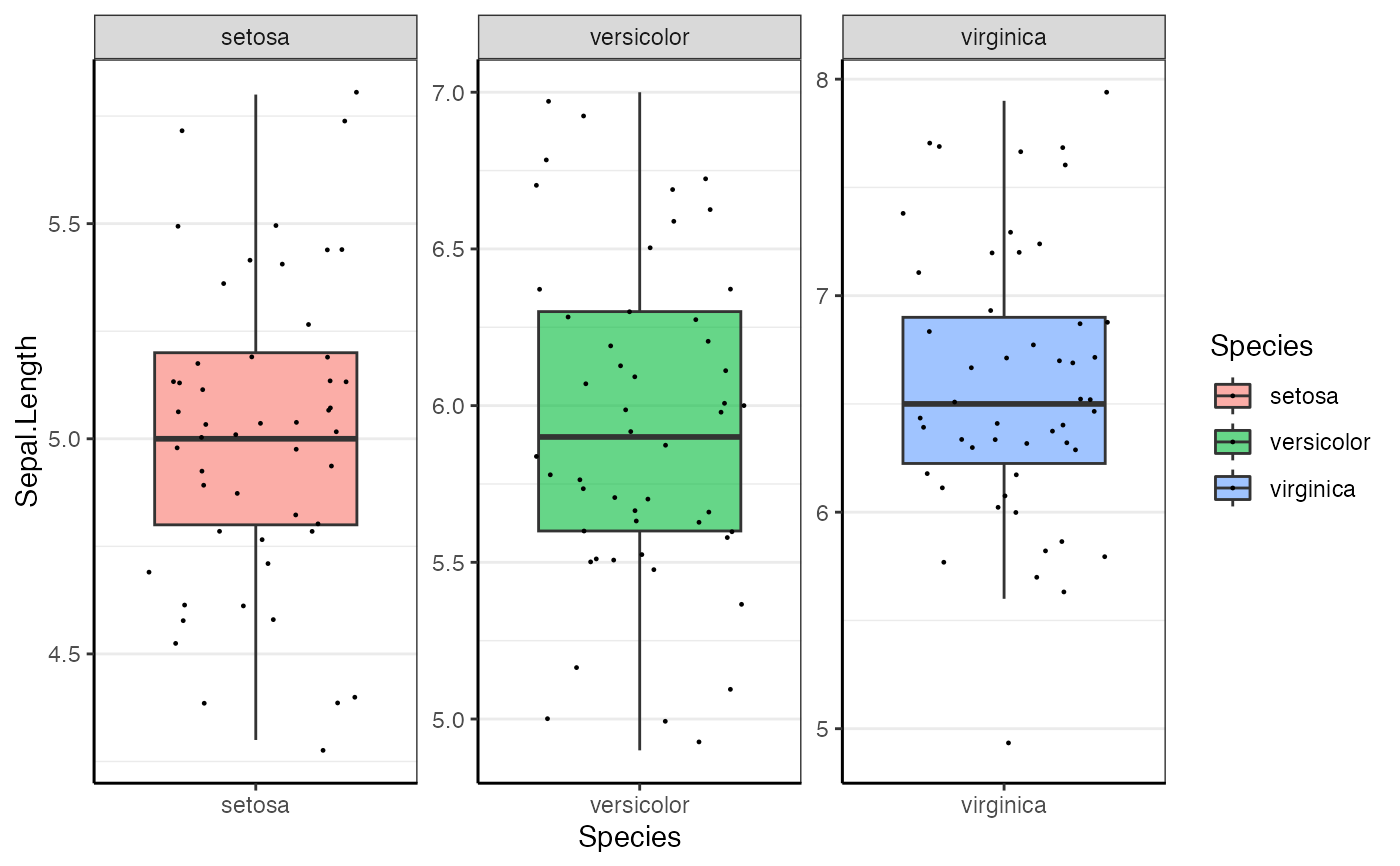
facet_boxplot(iris, x = "Species", y = "Sepal.Length", facet_var = "Species")