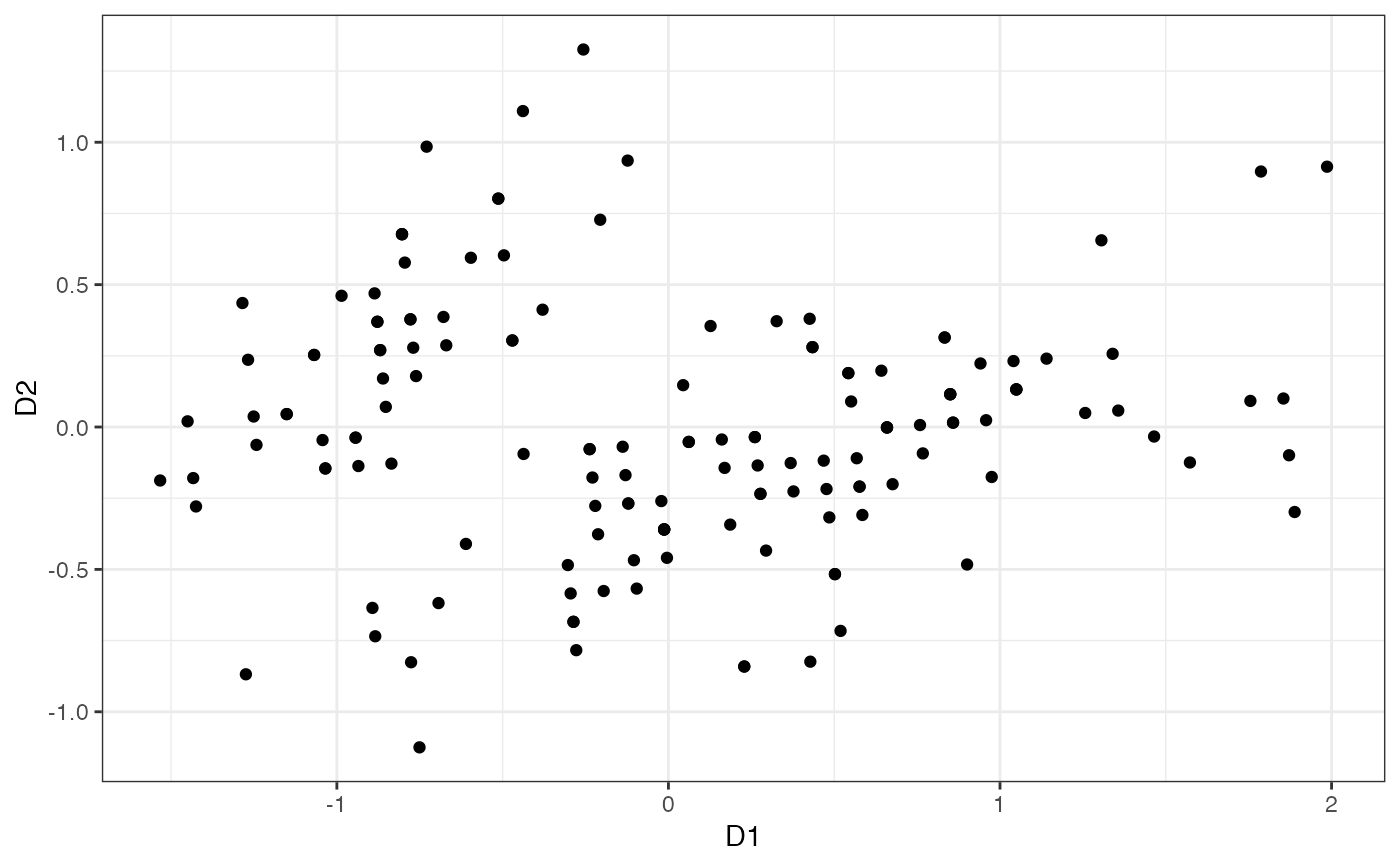
Plot a 2D MDS projection of a distance matrix
dmat_projection(dmat, point_colors = NULL, point_palette = NULL)Arguments
- dmat
distance matrix
- point_colors
optional list of labels to color points (will be coerced to factor)
- point_palette
optional palette used with
ggplot2::scale_colour_manual()
Value
a ggplot object